
What Is Bitcoin Dominance and How To Use It?

 Prefer us on Google
Navigating the ever-changing cryptocurrency market can be challenging, especially with fluctuating trends and shifting investor sentiment. One essential tool that provides clarity amid this complexity is Bitcoin dominance. This metric illustrates Bitcoin’s share of the total cryptocurrency market capitalization and reflects how capital rotates between Bitcoin and alternative cryptocurrencies (altcoins).
A rise in Bitcoin dominance often signals that investors are seeking stability and reducing exposure to higher-risk altcoins. Conversely, a decline may indicate growing speculation and increased interest in altcoins. Whether you’re building a diversified portfolio or just beginning your crypto journey, understanding Bitcoin dominance can offer valuable insight into market dynamics and help inform your strategic decisions.
In this article, we’ll explore what Bitcoin dominance is, how it’s calculated, what its movements reveal, and how you can apply this knowledge to enhance your investment approach.
What Is Bitcoin Dominance?
Bitcoin Dominance represents the proportion of the total cryptocurrency market capitalization that is attributed to Bitcoin. In essence, this metric highlights how much of the overall crypto investment is concentrated in Bitcoin compared to altcoins.
As the original and largest cryptocurrency by market value, Bitcoin often serves as a benchmark for the broader digital asset market. An increase in Bitcoin dominance typically suggests that investors are moving toward perceived safety and stability, often during times of uncertainty. A decrease, on the other hand, may indicate growing appetite for risk and speculation in altcoins.
Monitoring Bitcoin dominance can offer valuable insights into market sentiment, help detect trend transitions, and support more strategic asset allocation decisions.
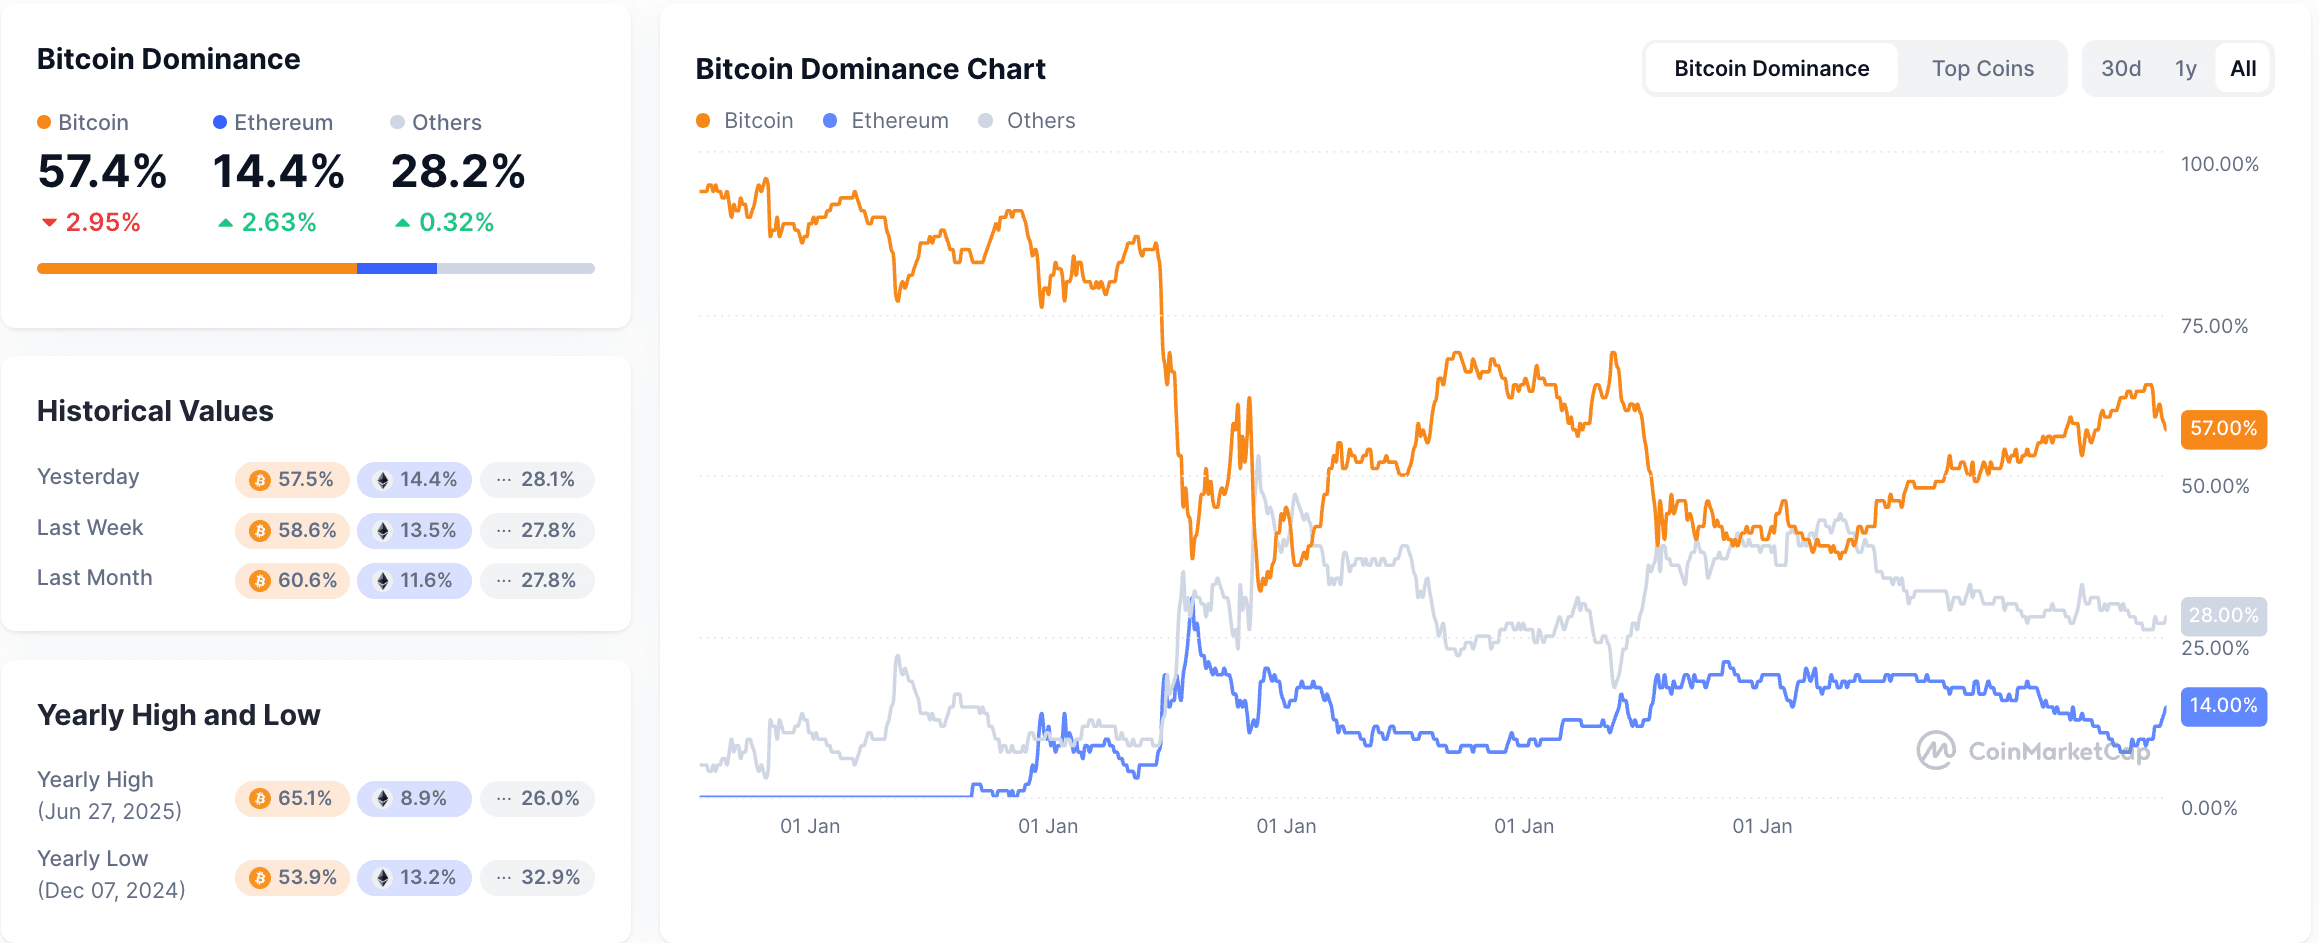
Source: CoinMarketCap
What Influences Bitcoin Dominance?
Bitcoin dominance can be affected by a variety of factors — both internal to the crypto market and external in the global economy.
How To Use Bitcoin Dominance in Trading
Bitcoin dominance should not be used in isolation—but it can serve as a valuable tool for making more informed decisions.
Here’s how many investors apply it:
- Adjusting Exposure: Increase or decrease allocation to Bitcoin versus altcoins in response to dominance trends.
- Gauging Market Sentiment: Rising dominance may reflect risk-off sentiment, while declining dominance often signals altcoin speculation.
- Identifying Reversals: Sharp changes in dominance can indicate market rotation or the end of a trend.
When combined with technical analysis, sentiment indicators, and macroeconomic insight, Bitcoin dominance adds meaningful context to both short-term trading and long-term investment strategies.
What Does High/Low Bitcoin Dominance Mean?
High Bitcoin Dominance (Above 60–65%)
A high Bitcoin dominance level indicates that the majority of capital within the cryptocurrency market is flowing into Bitcoin rather than alternative coins. This typically reflects a cautious or risk-averse sentiment among investors, who may be seeking the relative stability and established reputation of Bitcoin during uncertain market conditions. Such periods often coincide with Bitcoin-centric bull runs or broader market corrections.
Low Bitcoin Dominance (Below 50%)
A decline in Bitcoin dominance suggests that investors are increasingly allocating funds to altcoins, demonstrating growing confidence in alternative crypto projects and ecosystems. This environment frequently aligns with “altcoin seasons,” where tokens such as Ethereum, Solana, or various meme coins experience significant outperformance compared to Bitcoin, pointing to a more speculative and opportunity-driven market mood.
Bitcoin Dominance vs. Altcoin Season
Altcoin season occurs when altcoins deliver substantially higher returns than Bitcoin, typically triggered by a decline in Bitcoin’s market dominance below critical levels—often around 50%. During these phases, investors shift capital from Bitcoin into smaller-cap altcoins, driving rapid price appreciation across the broader crypto market.
Historically, altcoin rallies have followed strong Bitcoin bull runs, emerging once BTC’s upward momentum slows. Notable examples include the surges in 2017 and 2021, where declining Bitcoin dominance coincided with explosive altcoin performance. However, past trends do not guarantee future outcomes, as market conditions evolve with each cycle.
While Bitcoin dominance serves as a useful benchmark, traders should combine it with additional metrics—such as trading volume, trend strength, and individual altcoin market caps—to assess opportunities more accurately. A multi-indicator approach helps navigate the volatility and timing challenges inherent in altcoin seasons.
Conclusion
Bitcoin Dominance might sound complex, but it’s actually one of the easiest ways to gauge the crypto market’s health. For new traders, watching this metric can be a game-changer—whether you're looking for the right time to buy altcoins, manage risk, or just understand where the market stands.
Next time you check Bitcoin’s price, take a quick look at its dominance too. That one number could give you the edge you need to trade smarter.
Further Reading
Disclaimer: This content is provided for general branding and informational purposes only and doesn't constitute financial, investment, legal, or tax advice. Any events, rewards, online events, or related information mentioned herein should not be considered a recommendation, solicitation, or invitation to purchase, sell, trade, or otherwise deal in any crypto assets or to use any services. Crypto assets are highly volatile and may result in loss. WEEX services and online events may not be available in all regions and are subject to applicable laws, regulations, and eligibility requirements. You are responsible for ensuring that your use of WEEX services complies with local laws and for carefully assessing the risks before participating in any crypto-related activities.
You may also like

Why Is TSMC Stock Down After a 77% Profit Jump? What Wall Street Is Actually Worried About

Is Samsung Stock a Buy at Its Lowest Level Since the AI Boom Began?

Samsung Stock and the KOSPI Bear Market: What the 30% Decline From Peak Tells Investors

Oil Price Above $90: What the US-Iran War Means for Your Portfolio Right Now

Iran War and Bitcoin: Why Crypto Is Not Acting Like a Safe Haven at $90 Oil
KOSPI Stock Market Enters Bear Market: What a 25% Drop From the Peak Means for Investors

KOSPI Stock Bear Market: What It Means for Samsung, SK Hynix and Korean Chip Stocks
Is the KOSPI Stock Market a Buy After Entering Bear Market Territory?
SK Hynix Leveraged ETFs SKHL SKHX SKHZ: What Each One Does and Who Should Use Them
Barclays Sees 70% Upside for SK Hynix Stock: What the Overweight Rating Means
Is SK Hynix Stock a Buy Now? What the 52 Week Low and IPO Price Break Tell Investors
Is This Really Messi's Last World Cup? What the 2026 Final Means for His Legacy
Who Is Ferran Torres? The Substitute Who Won the 2026 World Cup for Spain
2026 FIFA World Cup Winner: Spain Beats Argentina to Claim Second World Title
SK Hynix Stock: SKHY's Wild Nasdaq Debut and What Comes Next
JEPQ Stock in 2026: Price, Monthly Dividend, and Real Risks

FIFA World Cup 2026 Final Winner: Spain Beat Argentina 1-0 in Extra Time
Cathie Wood AMD Stock Sale: Why ARK Keeps Trimming a 140% Winner

Argentina vs Spain World Cup Final 2026: Score and Crypto Fallout
B2H Crypto Scam or Legit? Back 2 Humans Meme Coin Explained
Intel Stock Forecast: Can AI and 18A Foundry Drive INTC Growth?
Nvidia Stock Forecast: What If AI Infrastructure Spending Slows?
Messi vs Mbappe Golden Boot Prediction Market: Who Wins the Race After the World Cup Final
Spain vs Argentina World Cup Final: What the Prediction Market Says and Why Traders Are Backing Spain
How to Buy TSMC Stock: What International Investors Need to Know Before Placing an Order
Is SPCX Stock Price a Buy Below Its IPO Price? What Happens Before August 6
SPCX Stock Price Falls Below IPO Price for the First Time: What Investors Should Do Now
TSMC Stock Price Prediction 2026-2027: Can TSM Reach $600 After the Q2 Beat?
Is TSMC Stock a Buy After Q2 Earnings? What 22x Forward Earnings and 61% AI Revenue Tell Investors

TSMC Stock Jumps After Record Q2 Earnings: What the AI Chip Boom Looks Like From the Inside
Why Is TSMC Stock Down After a 77% Profit Jump? What Wall Street Is Actually Worried About
Is Samsung Stock a Buy at Its Lowest Level Since the AI Boom Began?
Samsung Stock and the KOSPI Bear Market: What the 30% Decline From Peak Tells Investors
Oil Price Above $90: What the US-Iran War Means for Your Portfolio Right Now
Iran War and Bitcoin: Why Crypto Is Not Acting Like a Safe Haven at $90 Oil
KOSPI Stock Market Enters Bear Market: What a 25% Drop From the Peak Means for Investors
Contents
Popular coins
Latest articles